


Foreword
Turbo-propeller aircraft play a vital role in the global aviation landscape, particularly in regional and short-haul markets. Their efficiency, reliability, and flexibility make them indispensable for connecting smaller communities and remote regions and ensuring connectivity with the larger commercial transport system. Ongoing advancements in technology and safety systems have significantly improved their operational safety, reduced accident rates and supported increasing utilization.
The evolution of safety since 1980 illustrates the aviation industry’s ongoing commitment to continuous safety improvement.
This publication provides statistical analysis of fatal aviation accidents involving large turbo-propeller aircraft. A statistical analysis cannot provide a full picture of the threats and opportunities associated with the commercial aviation system. However, it is indicative of the overall improvements and illustrates the benefit of evolving technologies.
We stress that technology in combination with training, strong safety culture, the use of data and adherence to the latest procedures drives safety performance. The commercial aviation system is a highly complex interlinked system requiring each link in the chain to be effective. It is this context we strive to work with all our partners to build and maintain a safe and sustainable aviation system.
Christopher McGregor – ATR Flight Safety Officer
Definition
Fatal accident: An occurrence associated with the operation of an aircraft which takes place between the time any person boards the aircraft with the intention of flight until such time as all such persons have disembarked, in which a person is fatally injured as a result of:
-
- Being in the aircraft, or
- Direct contact with any part of the aircraft, including parts which have become detached from the aircraft, or
- Direct exposure to jet blast
Operational accident: An accident excluding terrorism acts, military actions, sabotage, suicide and the similar.
Hull loss: An accident in which the aircraft has been destroyed or beyond economical repairs.
Revenue flight: a flight involving the transport of passengers or freight. training, ferry, positioning, demonstration, maintenance, acceptance, and test flights are excluded.
Definition of key aircraft accident categories
| LOC_I: | Loss of control in flight, not primarily due to SCF | CFIT: | Controlled Flight into terrain, in-flight collision with terrain, water or obstacles without indications of loss of control |
| RE: | Runway excursion, veer off or overrun off the runway surface | ARC: | Abnormal runway contact. Hard landings and tail strikes are included in this category. |
| SCF: | Failure or malfunction of an aircraft system or component |
Scope
This brochure covers all the turbo-propeller commercial aircraft with 20 seats or above, including cargo aircraft on the same type, for which consistent commercial operational data are available.
The analysis starts in 1985, year of the first ATR flight.
Only commercial revenue value flights and operational accidents involving a hull loss or fatalities are considered.
Source of Data
For ATR aircraft, flight operations data and accident details are based on the ATR operators’ reported information and ICAO official accident qualification. For other aircraft type, the data are compiled by Cirium.
Accident rate are subject to adjustment following a change of the occurrence classification retrospectively.
List of aircraft type involved in the study:
- ATR 42 and 72,
- Let L-410 and L-610,
- Antonov AN-140 AN-24,
- BAE Viscount, ATP, HS 748, Jetstream 31, Jetstream 41
- De Havilland Canada , DHC-6, DHC-7 and DHC-8
- Dornier 228 and 328
- Embraer EMB-110 and EMB-120
- Fairchild Merlin IV, F-27 and FH-227
- Fokker 50 and F.27
- Convair 580
- Gulfstream G-159
- Hawker-Siddeley HS 748
- CASA C212, CN235
- NAMC YS-11
- Saab 2000 and 340
- Beech 1900
- Viking Air Short 330 and Short 360
- CAIC – MA60
- Aerospatiale Nord 262
ATR avionic technology
ATR developed the New Avionics Suite (NAS) with the new -600 series aircraft. It presents a significant technological leap forward in regional aviation, building on the proven reliability of earlier ATR models. The new glass cockpit features five LCD screens, improved situational awareness, and more intuitive flight management tools, taking greater benefit of automation to assist the flight crew. This development also allows continuous avionic upgrades via software uploads hence taking benefit of new technologies as they become available. At time of publication, we are now introducing NAS standard 4.

ATR 72-600 and ATR 42-600 cockpit.
The -600 series (ATR 42-600, ATR72-600 and ATR72-600F) is the ATR variant in production and has become quickly dominant within the ATR worldwide fleet. In relation to total fleet utilization, it now represents over 72% of all ATR operations.
Percentage of departures between ATR variants in 2025
Evolution of accident rate
Since the 1980s, the fatal accident rate for turbo-propeller aircraft has seen a notable improvement, reflecting decades of progress in aviation safety. Over time, improvements in aircraft design, more rigorous maintenance standards, enhanced training, and the integration of advanced safety technologies have significantly reduced both the frequency and severity of accidents. Regulatory efforts and global safety initiatives have equally contributed to this positive trend.
The graph below illustrates the number of flight cycles and the 10 years moving average per million flights for both the ATR-600 series and worldwide commercial turbo-propeller fleet.
In 2025, around 2.5 million flights are realized by the worldwide turbo-propeller fleet, for which the ATR-600 contributed nearly 40% of flights. The fatal accident rate for the ATR-600 series reaches zero, meaning the absence of any fatal accident in the past ten years.
The hull loss rate (-600 versus world commercial turbo-prop fleet) illustrates a similar trend improvement over the last 10 years. The challenge is to continue this trend even as the utilization continues to grow and improve upon the 0.35/million flight cycles.
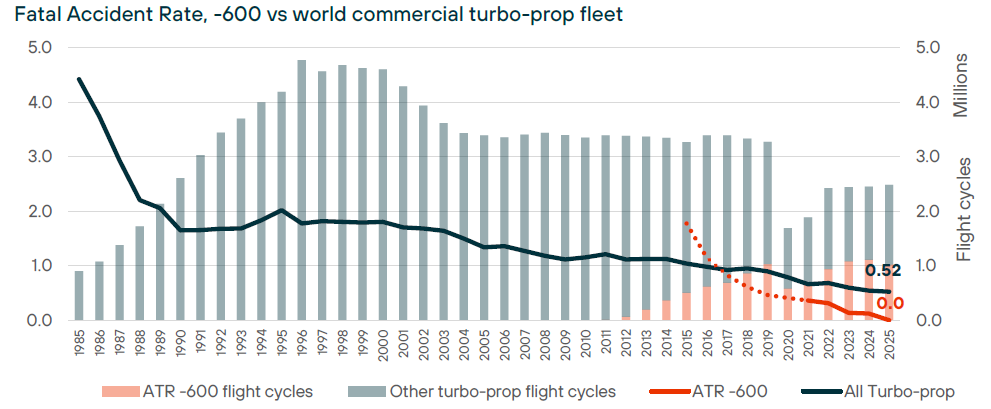
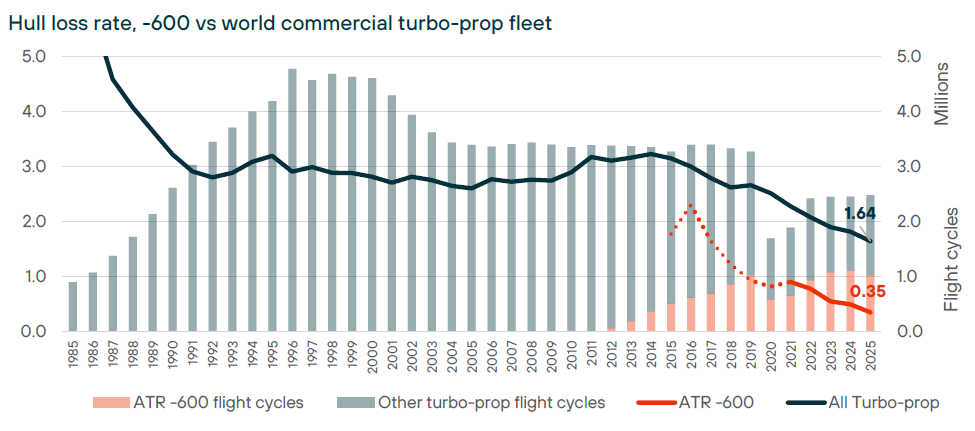
The rates for the -600 series are computed from 2021, corresponding the tenth-year anniversary of the entry into service. The dotted line gives the trend prior the tenth-year anniversary but may be statistically biased due to the absence of the ten-year feedback. The dotted line started in 2015, year when the -600 series accumulated one million flight cycles.
Zooming out to entire ATR fleet, the graphs below illustrate the 10 years moving rate per million departures for both ATR fleet and worldwide turbo-propeller fleet. For ATR aircraft, the data begins for the tenth-year anniversary after the entry into service of the first ATR (1985 with the ATR 42-300).
By 2018, ATR flight cycles become dominant and shared 50% of the flights of the turbo-propeller market with all other aircraft types combined, and it continues to increase. In 2025, ATR fleet achieved nearly 60% of the total world commercial departure for the large turbo-propellers fleet (above 20 seats).
The worldwide trend becomes increasingly statistically driven by the ATR in-service experience. The difference in aircraft generation also becomes apparent both in fatal accident rates and hull loss rates. We stress that technology in combination with training, strong safety culture, the use of data and adherence to the latest procedures drives safety performance.
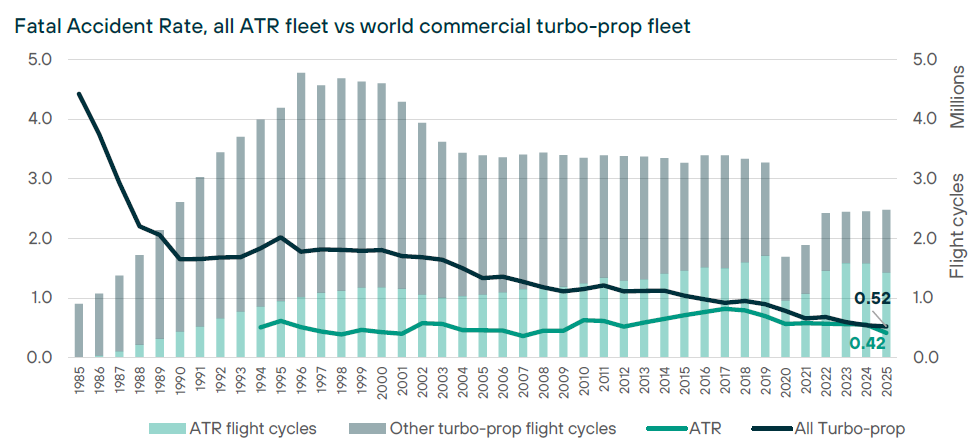
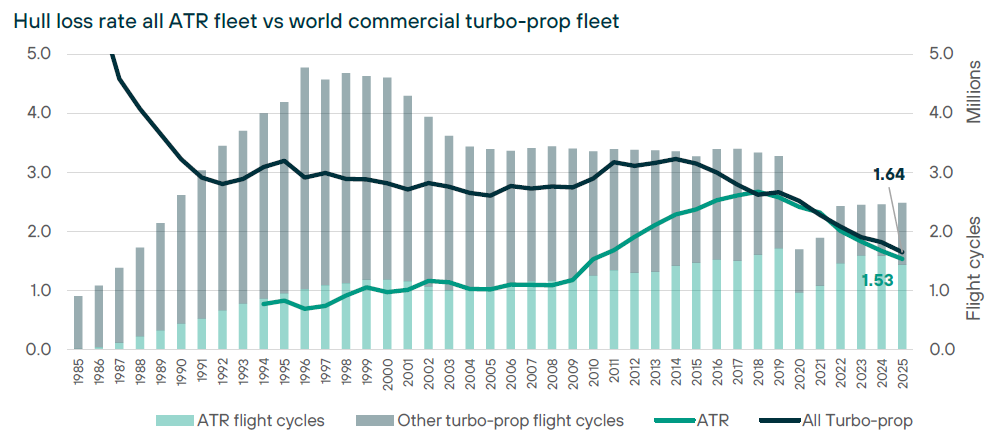
We observe a stable fatal accident rate on ATR fleet and an improving overall hull loss rate since 2018.
Accident Categories
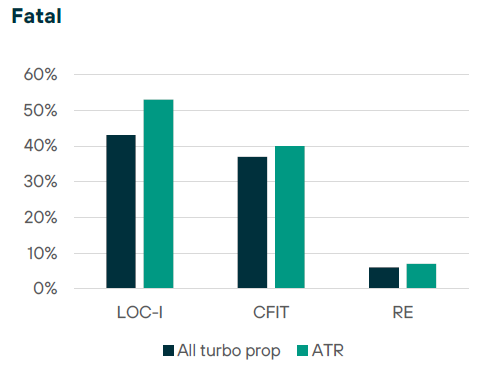
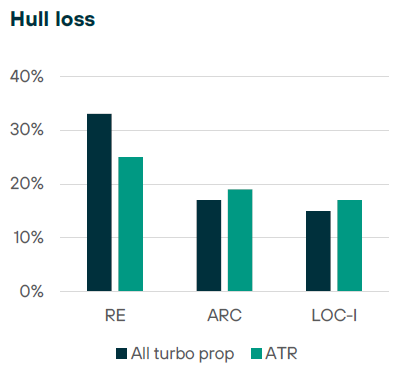
The charts below illustrate the main categories of accidents over the past 20 years for both fatal and non-fatal accidents for the turbo propeller for the world commercial turbo-prop fleet. The values are given in percentage of the total number of accidents.
LOC-I and CFIT represent a large majority of the fatal accidents for the large turbo-propellers, and the sole categories for the ATR fleet. In comparison we can observe the hull loss rate is primarily driven by the runway excursions (RE) and the abnormal runway contacts (ARC). Even though they do not necessarily lead to fatal injuries, the damage to the aircraft can be substantial and the risk of injury remains.

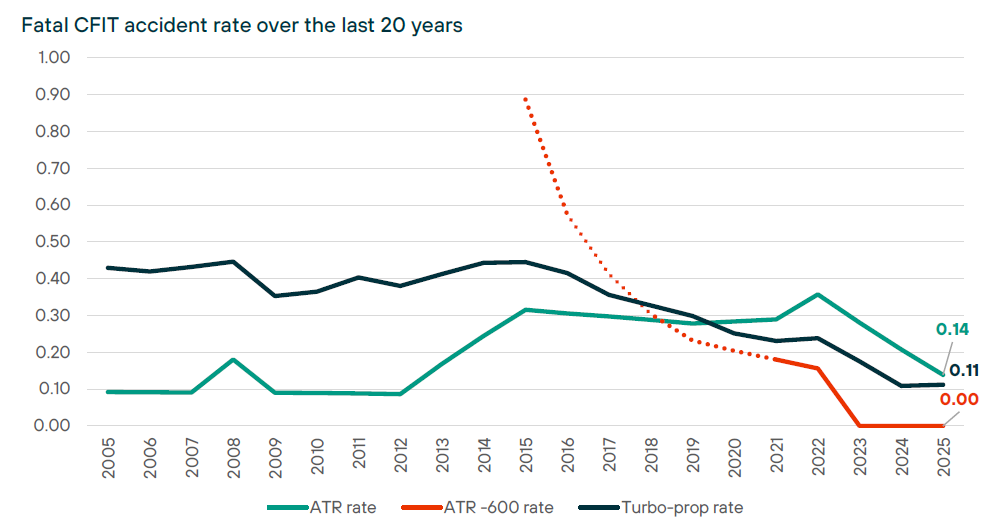
The rates for the -600 series are computed from 2021, corresponding the tenth-year anniversary of the entry into service. The dotted line gives the trend prior the tenth-year anniversary but may be statistically biased due to the absence of the ten-year feedback. The dotted line started in 2015, year when the -600 series accumulated one million flight cycles.
Conclusion
The statistical analysis demonstrates the industry’s commitment to continuous improvement in safety performance. However, we must never be complacent and must continue to implement flight safety improvement at every opportunity. This is ATR’s commitment.